
IoT Platforms in Smart Commercial Buildings 2025 to 2030
Navigate the Smart Building IoT Platforms Ecosystem: Complete Market Analysis Through to 2030
Our analysis provides clarity on the fragmented IoT platforms ecosystem, examining the architectural evolution, competitive positioning, and strategic roadmaps of key vendors through to 2030. With detailed market forecasts across three scenarios and actionable recommendations tailored to different stakeholder groups, this report delivers the strategic intelligence needed to capitalize on emerging technologies and align technology investments with measurable business outcomes.
The research includes 3 spreadsheets AND a presentation file with high-resolution versions of the charts. It is the 2nd in our 2025 series of IoT reports, with the 1st on IoT Devices.
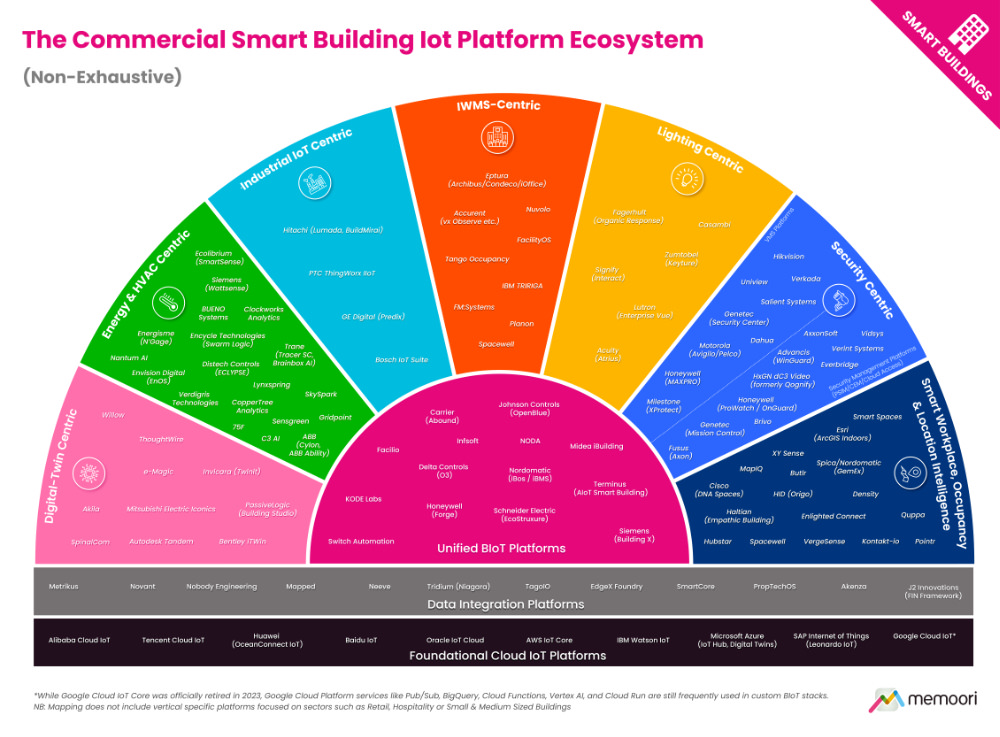
To help navigate the fragmented and rapidly evolving market for BIoT platform solutions, this report provides two key resources: a high-level mapping of the IoT platform ecosystem and a structured platform comparison presented in Appendix A. While we conducted a broad and systematic survey of the market, it is important to note that the Ecosystem Map is not intended to include every single vendor.
It should be noted that many vendors could arguably fit into multiple segments, depending on how their portfolios and go-to-market strategies are interpreted. For the purposes of this mapping, Memoori has placed each platform into the segment that we assess best reflects its primary strategic positioning and platform functionality.
KEY QUESTIONS ADDRESSED ABOUT IOT PLATFORMS
- What key capabilities should organizations look for when evaluating IoT platforms? Look for open architectures to prevent vendor lock-in, independent data layers for vendor-neutral integration, and robust security protocols. Despite the trend toward unified platforms from major vendors, no single provider offers comprehensive solutions across all building systems. Organizations should prioritize interoperability and modular approaches that allow best-of-breed solutions to work together effectively.
- How is AI transforming building operations beyond the marketing hype? AI is moving from theory to practice in three obvious areas: occupancy prediction that enables proactive HVAC adjustments, fault detection algorithms that identify equipment failures days before traditional methods, and autonomous energy optimization that reduces consumption by 15-25%. Companies like BrainBox AI are being acquired specifically for these capabilities. However, the market remains fragmented between genuinely AI-driven platforms and those merely offering rule-based automation rebranded as artificial intelligence.
- What does recent M&A activity reveal about the competitive landscape? The $16.8 billion in M&A transactions since 2023 shows traditional OEMs positioning digital platforms at the center of future revenue models. Corporate buyers like Trane and Schneider Electric are dominating acquisitions, while investment is concentrating among well-capitalized platforms aligned with sustainability trends. Smaller vendors face growing pressure to differentiate through specialized functionality or different business models to compete against integrated platforms.
For only 28 200 SEK (Enterprise Wide License) this report provides valuable information to companies so they can improve their strategic planning exercises AND look at the potential for developing their business.
Who should buy this report?
For building owners, technology providers, and investors, understanding this evolving landscape has become essential for maintaining a competitive advantage in an increasingly complex market.
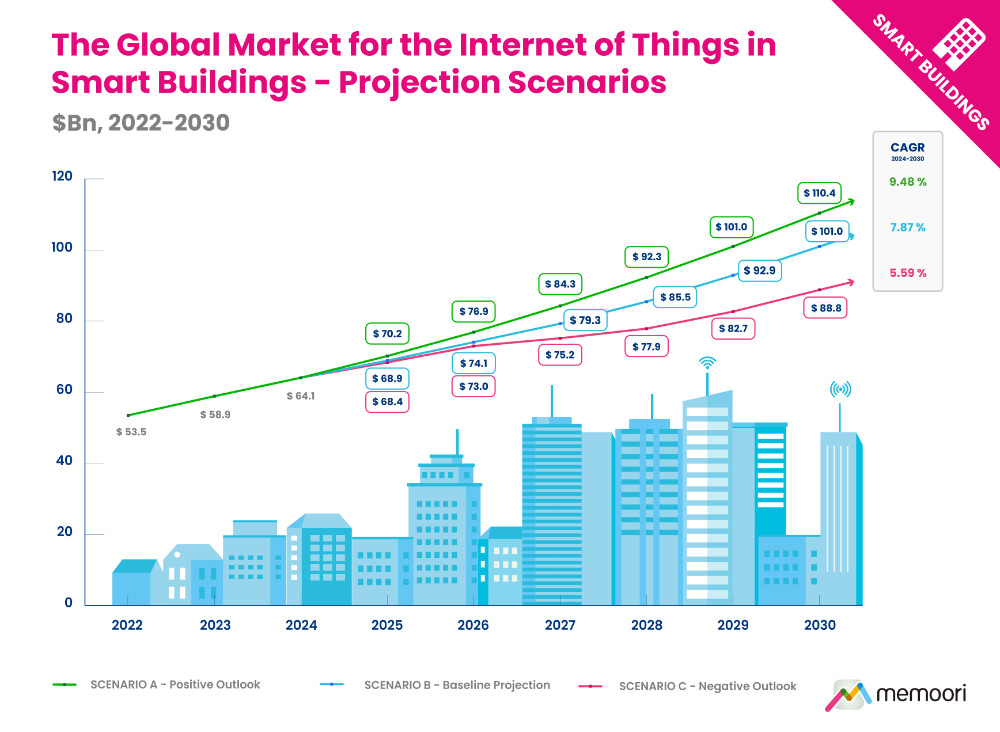
The report projects the global Building IoT market will grow from $64.1 billion in 2024 to $101.0 billion by 2030 (7.87% CAGR) under our baseline scenario, significantly lower than historical growth rates of 10-16%. We've developed three distinct projection scenarios to account for unprecedented macroeconomic uncertainty: Positive Outlook (9.48% CAGR), Baseline Projection (7.87% CAGR), and Negative Outlook (5.59% CAGR). Data Integration, Analytics & Software represents the largest and fastest-growing category (9.53% CAGR), indicating a market increasingly focused on software-defined value rather than hardware.
Table of contents
- Preface
- The Executive Summary
- Introduction
- Overview of the IoT Market in Smart Commercial Buildings
- Mapping the BIoT Supply Chain
- IoT Solution Maturity and Market Evolution
- Economic and Policy Pressures Impacting BIoT Markets
- Evaluating the Impact of the Trade War
- USChina Trade and Technology Tensions
- Broader Regional Trade and Policy Impacts
- Evaluating the State of Broader Technology Markets
- Evaluating the Impact of the Trade War
- Market Sizing & Regional Analysis
- Market Projection Scenarios
- Scenario Framework and Assumptions
- Scenario Forecasts
- Global Market Breakdowns
- Market Breakdown by Hardware, Software & Services
- Market Breakdown by Building Vertical
- Market Breakdown by Application
- Regional Forecasts & Analysis
- North America
- Latin America
- Asia Pacific
- Europe
- Middle East & Africa
- Market Projection Scenarios
- IoT Platforms
- The Role of IoT Platforms in Smart Commercial Buildings
- The BIoT Stack
- The IoT Platform Ecosystem & Competitive Landscape
- Mapping the IoT Platform Ecosystem
- Evaluating the Competitive Landscape
- Foundational Cloud IoT Platforms
- Data Integration Platforms
- Digital Twin-Centric Platforms
- Energy & HVAC-Centric Platforms
- Industrial IoT-Centric Platforms
- IWMS-Centric Platforms
- Lighting-Centric Platforms
- Security-Centric Platforms
- Smart Workplace / Occupancy / Location Intelligence Platforms
- Unified BIoT Platforms
- Vertical Specific Platforms
- Notable Platform Trends
- Convergence and Integration Dynamics
- A Shift Towards Open, Modular, and Scalable BIoT Platforms
- Evolving Computational Models
- AI, Analytics, and Autonomous Control
- Evolving Business Models
- Risk Management
- Regional Market Dynamics & Market Bifurcation
- Recommendations for Stakeholders
- Navigating Common Challenges in BIoT Platforms
- A Checklist for Evaluating Platform Maturity
- Strategic Recommendations by Stakeholder Group
- M&A & Investment Trends
- Investments
- Notable Investment Trends
- Mergers & Acquisitions
- Notable M&A Trends
- Investments
- Introduction
- Fig 1.1 The Internet of Things in Smart Commercial Buildings 2025 v6.0
- Fig 1.2 The BIoT Supply Chain
- Fig 1.3 BIoT Solution Maturity
- Fig 2.1 US/China Trade Barriers - A Timeline - 2018 to Present
- Fig 3.1 The Global Market for the Internet of Things in Smart Building - Projection Scenarios to 2030
- Fig 3.2 The Global Market for the Internet of Things in Smart Building, Breakdown by Hardware, Software & Services 2024
- Fig 3.3 Market Breakdown by Hardware, Software & Services, Breakdown by Category 2024
- Fig 3.4 The Internet of Things in Smart Commercial Buildings Market by Vertical 2024
- Fig 3.5 The Internet of Things in Smart Commercial Buildings Market by Application 2024
- Fig 3.6 Regional Growth Indicators
- Fig 3.7 The Internet of Things in Smart Commercial Buildings Market by Region 2024
- Fig 3.8 The Market for the Internet of Things in Smart Commercial Buildings North America 2024
- Fig 3.9 The Market for the Internet of Things in Smart Commercial Buildings Latin America 2024
- Fig 3.10 The Market for the Internet of Things in Smart Commercial Buildings Asia Pacific 2024
- Fig 3.11 The Market for the Internet of Things in Smart Commercial Buildings Europe 2024
- Fig 3.12 The Market for the Internet of Things in Smart Commercial Buildings Middle East & Africa 2024
- Fig 4.1 Typical IoT Platform Functionality
- Fig 5.1 The Commercial Smart IoT Platform Ecosystem
- Appendix A - BIoT Platform Comparison Matrix
- Appendix B - M&A & Investments Summary
Utgiven: Q2 2025
Diagram och tabeller: 18 st
Pris:
28 200 SEK (exkl. moms) / Enterprise License *
* Enterprise License is a company-
wide license. Anyone within the company can view the document.