
The Physical Security Business 2022 to 2027
This Report is the New 2021 Definitive Resource for Access Control, Video Surveillance & Intruder Alarm / Perimeter Protection Market Research.
This report is our 14th annual market analysis that brings together all the factors influencing this industrys future. We assess the structure and size of the combined physical security industry then break down the market by product type, sales by vertical sector and geographic region, and forecast sales to 2027. It INCLUDES at no extra cost, a spreadsheet listing all major companies categorised by revenue, acquisitions, and investments AND a graphics pack with high-resolution charts from the report.
The report shows that the market for Physical Security products has demonstrated a remarkable degree of both resilience and adaptability over the course of the COVID-19 pandemic, with recovery proving particularly strong in 2021 for most major players in the market.
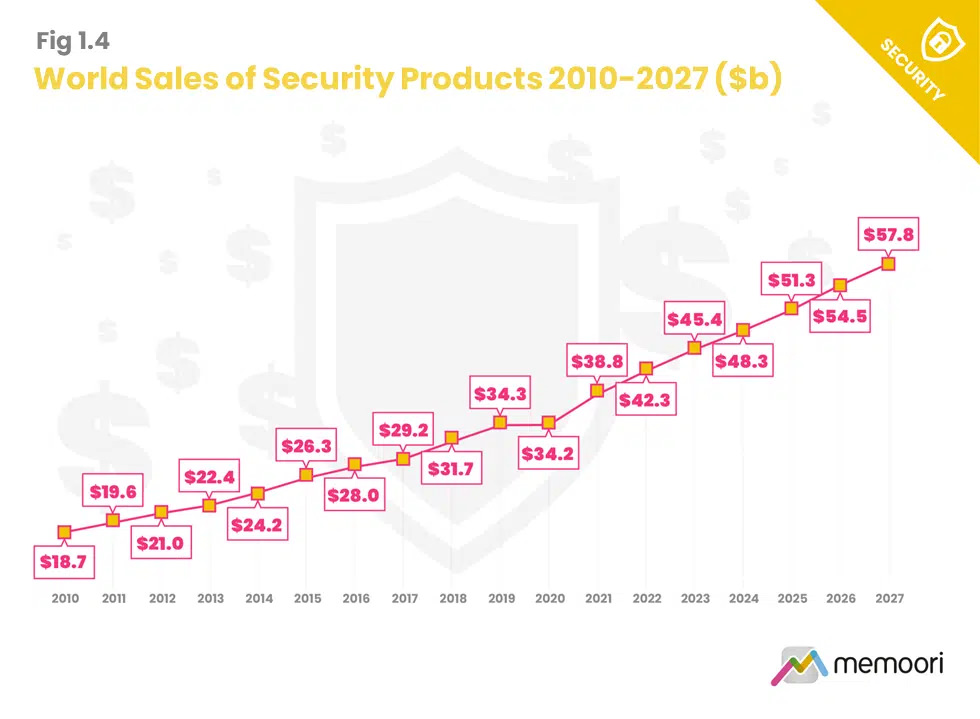
Memoori estimates annual revenues from the physical security product market should increase 9.13% in 2022, rising to $42.3Bn, and predict that between 2023 and 2027, growth will average around 6.5% per annum.
Key Questions Addressed:
- What is the global physical security markets shape, size and structure in 2022? How is the market broken down into Access Control, Video Surveillance and Intruder Alarm/Perimeter Protection Equipment? Where are the dominant geographic markets in the world? How are sales split between 16 different industry verticals?
- What are the main drivers for industry growth? How will the market grow over the next 5 years? Which technologies are helping to reshape this market and create new business models?
- How are mergers, acquisitions and investments impacting the industry? How does acquisition activity stack up against previous years both in terms of value and volume? How much investment has the market attracted from venture capital and private equity this year?
Within its 234 Pages and 28 Charts and Tables, This Report Presents All the Key Facts and Draws Conclusions, so you can Understand what is Shaping the Future of Electronic Systems in the Security Industry:
- The Chinese video surveillance market continues to dominate global sales accounting for just under one-third of the total global market, followed by North America with just over a quarter. Chinas Sharp Eyes project mandated 100% surveillance coverage for public areas and key industries by the end of 2020. While the program (part of the 13th Five-Year plan released in 2016) technically came to an end in 2020 delays in project rollout due to the pandemic mean some investments continued into 2021. The winding down of the Sharp Eyes program may indicate a decline in future government investment in the domain, but we do still expect robust levels of government investment and support for innovation in the sector to continue.
- Memooris Q1 2021 analysis of Artificial Intelligence (AI) in Smart Buildings found that the Security & Access control market, and particularly video analytics generates the lions share of overall AI revenues in smart buildings, representing just under 50% of total sales in 2020 at $558 million.
- An enormous amount of investment has been ploughed into the development and deployment of the latest generation of broadband cellular network technology, known as 5G. Many analysts and industry observers contend that the proliferation of 5G will have a major impact on the video security market, arguing that in the years to come, we will see the proliferation of large networks of wireless cameras streaming ultra-high-definition video in real-time. We do not share this view. In fact, as of 2022, we see very little momentum or market appetite from either camera manufacturers, integrators or end users for the deployment of 5G wireless surveillance usage at scale. We estimate that the introduction of 5G for video surveillance data transmission will take at least another 5 years to achieve the levels of coverage, reliability and falls in cost to have any kind of real impact.
Starting at only USD 2,500 for a Single User License, this report provides valuable information into how physical security companies can develop their business strategy through mergers, acquisitions, and alliances.
Over the last 20 years, the average annual total of all acquisitions was over $6.7 Billion, and the average number of deals was 42. In 2022 we have identified a total of 43 deals, a moderate rise from the 38 from last year. The total estimated deal value came in at just over $9.8 billion, which ranks 2022 as the 4th highest of any year in the last 20, with a total that is 45% higher than the annual average of over $6.7 billion.
Who should buy this report?
The information in this report will be of value to all those engaged in managing, operating, and investing in electronic security technology companies (and their advisors) around the world. In particular, those wishing to acquire, merge or sell companies will find its contents particularly useful.
Table of contents
- Preface
- Executive Summary
- 1. The Structure, Shape & Size of the Physical Security Business 2022
- 1.1 Company Classifications
- 1.2 Market Share by Group
- 1.3 Physical Security Market forecasts
- 1.4 World Sales of Security Products by Type (Video, Access, Intruder Alarm & Perimeter Protection)
- 1.5 Market Size & Trends by Major Region
- 1.6 Market Size & Trends by Vertical
- 2. The Video Surveillance Market
- 2.1 Video Surveillance Market Forecasts
- 2.2 Video Cameras
- 2.3 Video Surveillance Software
- 2.4 VSaaS
- 2.5 Body Worn Cameras
- 2.6 Demand Drivers & Technology Trends for Video Surveillance
- 3. The Access Control Market
- 3.1 Access Control Market Forecasts
- 3.2 Access Control Supplier Performance
- 3.3 Demand Drivers & Technology Trends for Access Control
- 4. Intruder Alarms / Perimeter Protection (IA/PP) Market
- 4.1 IA/PP Market Forecasts
- 4.2 IA/PP Supplier Performance
- 4.3 Demand Drivers & Technology Trends for IA/PP
- 5. Physical Security Software Markets
- 5.1 PSIM
- 5.2 PIAM
- 6. The Internet of Things (IoT)
- 7. AI and Machine Learning
- 8. Evolving Deployment Models (Cloud & Edge)
- 8.1 Cloud
- 8.2 Edge
- 9. Wireless & Cellular Technologies
- 9.1 The Impact of 5G
- 9.2 Wireless for Video Surveillance
- 9.3 Wireless for Access Control
- 9.4 Wireless for IA/PP
- 10. Geopolitical Tensions & Trade Barriers
- 10.1 US/China Dynamics
- 10.2 The Realities of Trading in China for non-Chinese firms
- 10.3 Implications of the Trade War for Non-Chinese Manufacturers
- 10.4 Impacts in Europe
- 10.5 Trends in Other Nations
- 11. Supply Chain Trends
- 11.1 Ongoing Supply Chain Woes
- 11.2 Physical Security Market Impacts
- 11.3 Future Supply Chain Prospects
- 11.4 Supply Chain Resilience
- 11.5 The War in Ukraine
- 12. Long-term COVID-19 Impacts
- 12.1 Strategic Thinking
- 12.2 Physical Security Investments
- 12.3 Ways of Working & Behavioral Change
- 13. Sustainability
- 13.1 Product Sustainability
- 13.2 Contributions to Corporate Energy Efficiency / Sustainability
- 14. Skills, Talent & Labor
- 15. Cyber Security
- 15.1 The Status of Cyber Security for Physical Security Devices
- 15.2 Cyber Security Incidents in Physical Security
- 16. Data Privacy & Ethics
- 16.1 Data Privacy
- 16.2 Governance & Ethics
- 17. Open Standards
- 17.1 The Benefits of Open Standards
- 17.2 Progress towards Open Systems
- 17.3 The OSSA
- 18. Policy, Regulation & Standards
- 18.1 Video Surveillance Standards
- 18.2 Access Control Standards
- 18.3 Data Privacy Regulations
- 18.4 Facial Recognition Regulations
- 18.5 Cyber Security Regulations
- 19. M&A, Investment & Strategic Alliances
- 19.1 M&A Performance 2002-2022
- 19.2 M&A Performance in 2022
- 19.3 M&A Valuation Exit Multiple Benchmarks
- 19.4 M&A By Business Segment in 2022
- 20. Investment Trends Analysis
- 21. Strategic Alliances
List of charts and figures
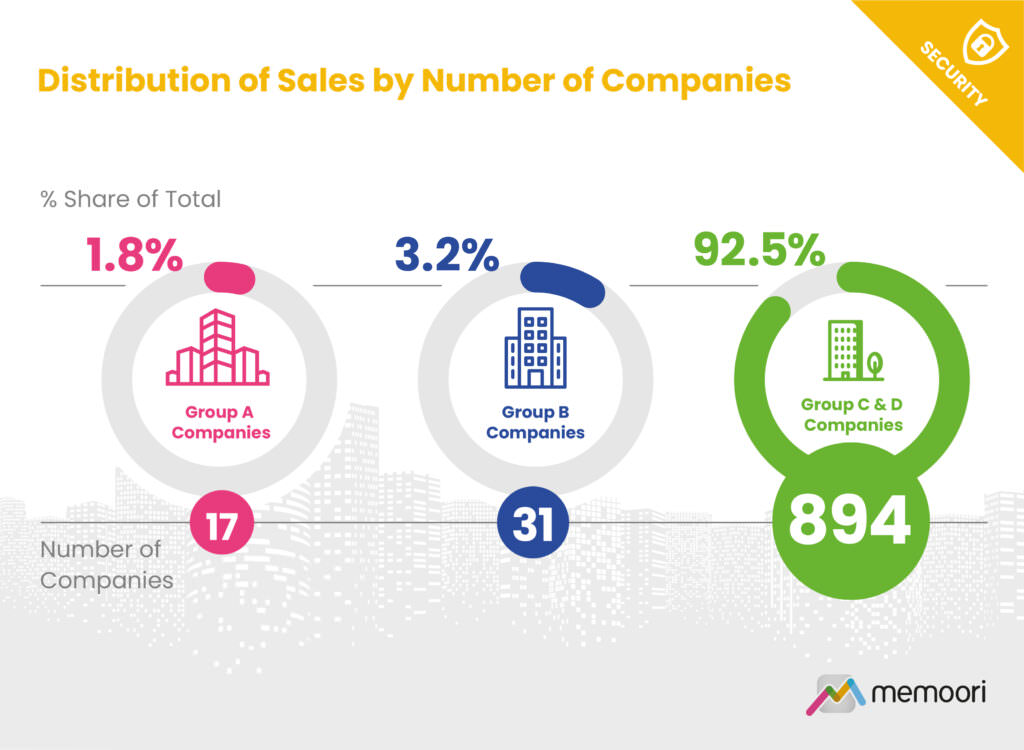
- Fig 1.1 Distribution of Sales by Number of Companies
- Fig 1.2 Distribution of Sales by Major Grouping
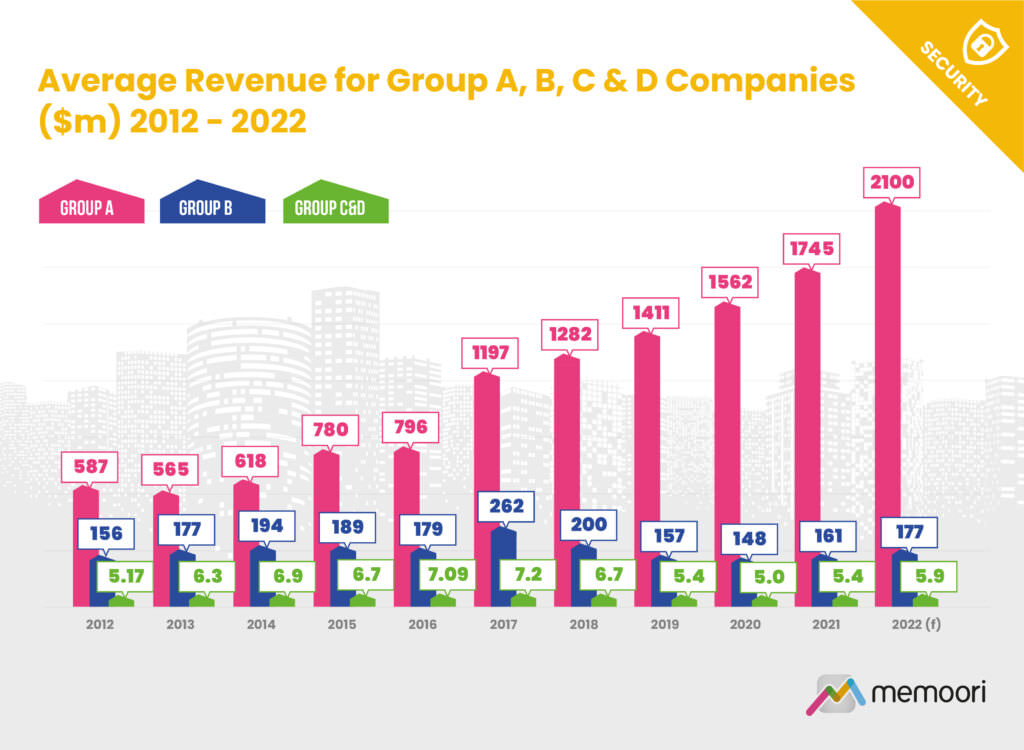
- Fig 1.3 Average Revenue for Group A,B,C & D Companies ($m) 2012 2022
- Fig 1.4 World Sales of Security Products 2010 2027 ($Bn)
- Fig 1.5 World Sales of Security Products by Type 2022
- Fig 1.6 World Distribution of Security Products by Major Regions 2022
- Fig 1.7 Physical Security Sales by Major Region 2022
- Fig 1.8 Distribution of Security Systems by Building Type 2012 compared with 2022
- Fig 2.1 World Sales of Video Surveillance Products 2017 2027 ($Bn)
- Fig 2.2 World Sales of Video Surveillance Cameras 2017 2027 ($Bn)
- Fig 2.3 Relative Performance of Vendors in the Video Surveillance Camera Market 2022
- Fig 2.4 World VMS Market for Video Surveillance 2017 2027 ($Mn)
- Fig 2.5 Relative Performance of Vendors in the VMS Market 2022
- Fig 2.6 World Market for VSaaS 2017 2027 ($Bn)
- Fig 3.1 World Sales of Access Control Products 2017 2027 ($Bn)
- Fig 3.2 Relative Performance of Vendors in the Access Control Market 2022
- Fig 4.1 World Sales of Intruder Alarm / Perimeter Protection Products 2017 2027 ($Bn)
- Fig 4.2 Relative Performance of Vendors in the Intruder Alarm / Perimeter Protection Market 2022
- Fig 19.1 Security Deals Completed from 2002 to 2022 Estimated Total Value of Deals ($m)
- Fig 19.2 Merger & Acquisition Activity by Business Segment 2022
- Fig 21.1 Strategic Alliances 2008 2022
Spreadsheet
- The Worlds Major Physical Security Companies 2022
- Physical Security Acquisitions October 2021 to the End of September 2022
- VC and Private Equity Investments
Companies Mentioned Include AMONG OTHERS
- ACRE | ACTi Corporation | ADT | Agent Vi | Aimetis | Alcatraz AI | Allied Universal | Allegion | Amazon | Ambient AI | AnyVision | Arcules Global | Arecont Vision | Assa Abloy | Avigilon | Axis Communications | Axsys Technologies | AxxonSoft | Basler | Blighter Surveillance | Bosch | BriefCam | Brivo | ButterflyMX | Calipsa | Canon | CDVI | CheckPoint Systems | CIAS | Cisco | Civic Technologies | CNB Technology | CNL Software | CSST | Dahua | Dallmeier | Deep Sentinel | Digital Barriers | Dormakaba | DVTel | Eagle Eye Networks | Elkron | Envysion | Evolon | Firetide | Flir | Flock Safety | FluidMesh | G4S | Gallagher | Genetec | Geutebruck | Google | Gunnebo | Halma | Hanwha Techwin | HID Global | Hikvision | Hitachi | Hitron | Hivewatch | Honeywell | Huawei | IDEMIA | Identiv | IDIS | iLoq | Indigovision | Infinova | Intelbras | Isonas | Jablotron | Johnson Controls | JVC | Keri Systems | Legic Identsystems | LG | Magal Security Group | Mango DSP | March Networks | Megvii | Mercury Security | Microsoft | Milestone Systems | Mirasys | Mitsubishi | Motorola Solutions | Napco Security | Nedap | Nexkey | Nuuo | Object Video | Openpath | Optex | Panasonic | Paxton | Pelco | Pivot3 | Primion Technology AG | promiseQ | Pyronix | Qognify incl Nice Systems Security | Remotelock | Rhombus Systems | Risco Group | Salto | Schneider Electric | SeeTec Communications GmbH | Senstar Stellar | SimonVoss | Smartvue | Sony | Stanley Black & Decker | Suprema | Sureview | Synectics | Tamron | TDSi | Teleste | Tiandy | TKH | Ubiquiti | Uniview | UTC | Vanderbilt | Verint | Verkada | Vidsys | Vicon | VideoIQ | Viakoo | Vivotek | Waltz | Wavesight | Wavestore | Zerv | Zicom

Charts & Tables: 28
Released: Q4 2022
Price:
USD 2,500 / Single User License *
USD 2,750 / Enterprise License **
* Single User License, this Report may not be copied, quoted or distributed without permission.
** Enterprise License is a company-
wide license. Anyone within the company can view the document.